RFirst Steps in R

Previous topic

Contents

Next topic

Main features of R

This Page

First steps in R does not pretend to be a comprehensive guide to R package (there are many excellent books and web tutorials) but it aims at providing an introduction to the R statistical package for the (under)graduate students following an introductory Statistics Course.

Introduction

Why R?

Although there are many tools that can be employed for statistical analysis (SAS, SPSS, Stata, Minitab, MATLAB, Wolfram Mathematica,... among others), we have chosen R because:

  • It is an integrated environment: it has been developed as a whole entity and not as a collection of tools. It includes:
    • An efficient system for data storage and manipulation
    • A collection of tools to manage arrays
    • Integrated tools for data analysis
    • Screen graphs and portable format graphs generation
    • A simple and effective programming language (with scripting capabilities)
  • It is free software! Available through the project WEB or through CRAN (Comprehensive R Archive Network)
  • Available for different platforms (source code and pre-compiled binaries): UNIX, MacOS, Windows
  • ...
  • Many scientists are using it!
_images/hpgraphic.png

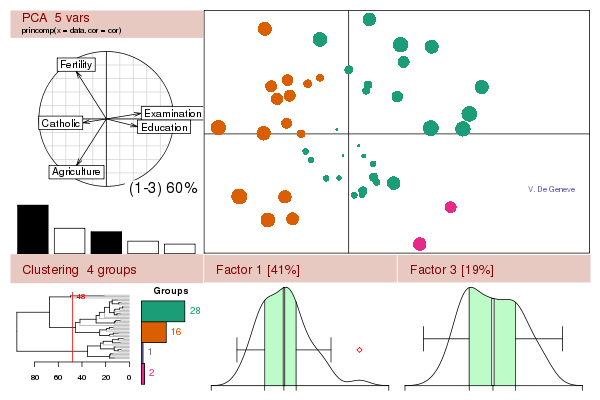
(image from R project web page)

R is continuously (and exponentially) growing with the addition of contributed packages.

_images/exponential-growth.png

(from R Journal)

Although... No statistical package can work miracles!

(GIGO: Garbage In, Garbage Out)

_images/garbageinout.png

(image from http://www.lovemytool.com)